Axiomatic Explanations for Visual Search, Retrieval and Similarity Learning
AXIOMATIC EXPlanATIONS FOR VISUAL SEARCh, RETRIEVAL, AND SIMILARITY LEARNING
Authors:Mark Hamilton ${ }^{1,2}$, Scott Lundberg ${ }^{2}$, Stephanie Fu ${ }^{1}$, Lei Zhang ${ }^{2}$, William T. Freeman ${ }^{1,3}$
${ }^{1}$ MIT, ${ }^{2}$ Microsoft, ${ }^{3}$ Google
markth@mit.edu
**Authors of the blogpost**: Yassine Beniguemim and Noureddine BOULLAM.Table of Contents
- Abstract
- Introduction
- Exploring Visual Search Algorithm Explanations
- Implementing Second-Order Explanations in Practice
- Conclusion
Abstract
Visual search, recommendation, and contrastive similarity learning are pivotal technologies shaping user experiences in the digital age. However, the complexity of modern model architectures often obscures their inner workings, making them challenging to interpret. In our blog, we delve into a groundbreaking paper titled “AXIOMATIC EXPLANATIONS FOR VISUAL SEARCH, RETRIEVAL, AND SIMILARITY LEARNING” authored by Mark Hamilton et al. This paper introduces a novel framework grounded in the theory of fair credit assignment, providing axiomatic solutions that generalize existing explanation techniques and address fairness concerns in recommendation systems. Through our exploration, we aim to demystify the complexities of visual search algorithms, offering readers insights into their operation and implications for various domains.
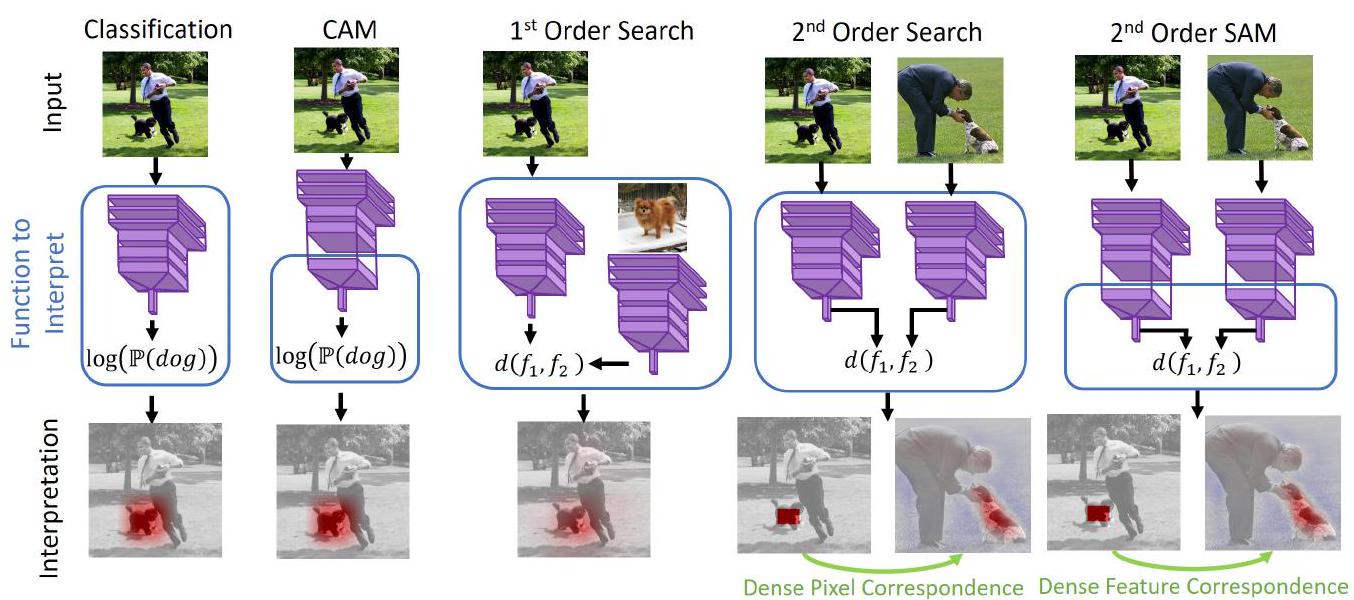
Figure 1: Architectures for search engine interpretability. Like classifier explanations, First-order search explanations yield heatmaps of important pixels for similarity (bottom row third column). Second order search interpretation methods yield a dense correspondence between image locations (last two columns). CAM (second column) is a particular case of Shapley value approximation, and we generalize it to yield dense correspondences (last column).
Introduction
Welcome to our blog, where we embark on a journey to demystify the intricate world of visual search technology. In today’s digital age, recommendation systems play a pivotal role in guiding users through a vast sea of information, aiding in everything from online shopping to content discovery.
Yet, behind the scenes, these recommendation engines operate using sophisticated algorithms that can seem like a black box to many users. How do they decide which products to suggest, or which images are most similar to a given query? These questions lie at the heart of our exploration.
Inspired by the groundbreaking paper “AXIOMATIC EXPLANATIONS FOR VISUAL SEARCH, RETRIEVAL, AND SIMILARITY LEARNING” authored by Mark Hamilton et al., we embark on a quest to unravel the inner workings of these recommendation systems. By delving into the concepts of fair credit assignment, Shapley values, and Harsanyi Dividends, we aim to shed light on the underlying principles that govern visual search algorithms.
1. Exploring Visual Search Algorithm Explanations
In our exploration of visual search algorithm explanations, we delve into the fundamental concepts introduced in the paper by Mark Hamilton et al. Our journey begins with an examination of the two distinct classes of explanation methods: “first order” and “second order.” First-order approaches focus on highlighting important pixels contributing to object similarity, while second-order explanations provide a comprehensive correspondence between query and retrieved images.
1.1 First-Order Explanations
First-order interpretations are rooted in classifier explainability theory, offering insights into the importance of individual pixels or features in determining object similarity. We explore the theoretical underpinnings of these explanations, drawing parallels to existing techniques such as Class Activation Maps (CAM), GradCAM, and LIME.
Formalizing First-Order Interpretations
The core of first-order explanations lies in the formalization of the value function, typically represented as $v_1(S)$, where $S$ represents subsets of features or pixels. This function allows us to quantify the contribution of each subset to the overall similarity score between query and retrieved images.
$$ v_1(S): 2^N \rightarrow \mathbb{R} := d(x, \text{mask}(y, S)) $$
1.2 Unifying First-Order Search Interpretation Techniques
Building upon existing classifier explainability methods, we introduce an approach to transform opaque and grey-box classification explainers into search engine explainers. By formalizing the value function and leveraging concepts like Shapley values, we extend existing approaches such as LIME and SHAP to the realm of visual search.
Leveraging Shapley Values
Shapley values provide a principled way to assign credit to individual features or pixels based on their contribution to the similarity function. By applying Shapley values to the search engine context, we can identify the most influential elements in both query and retrieved images.
$$ \phi_{v_1}(S) = \sum_{T: S \subset T} \frac{d_v(T)}{\binom{|T|}{|S|}} $$
1.3 Second-Order Explanations
Moving beyond pixel-level interpretations, we delve into second-order explanations that capture the interactions between areas of query and retrieved images. Drawing inspiration from Harsanyi Dividends and Shapley-Taylor indices, we explore how these concepts generalize to provide richer insights into image similarity.
Understanding Second-Order Interpretations
Second-order explanations go beyond individual features to capture the interaction strength between different parts of query and retrieved images. We introduce the concept of Harsanyi Dividends, which provide a detailed view of the function’s behavior at every coalition of features.
$$ d_v(S) = \begin{cases} v(S) & \text{if } |S|=1 \ v(S) - \sum_{T \subsetneq S} d_v(T) & \text{if } |S| > 1 \end{cases} $$
1.4 A Fast Shapley-Taylor Approximation Kernel
While Harsanyi Dividends and Shapley-Taylor indices offer robust credit assignment mechanisms, their computation can be challenging. We introduce a novel weighting kernel for second-order Shapley-Taylor indices, significantly reducing computational complexity while maintaining accuracy.
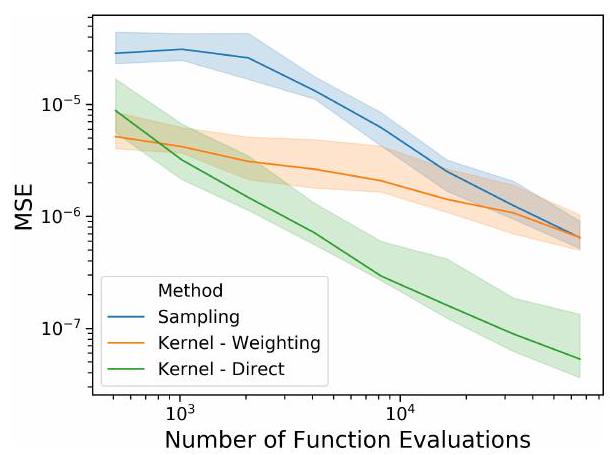
Figure 5: Convergence of Shapley-Taylor estimation schemes with respect to the Mean Squared Error (MSE) on randomly initialized deep networks with 15 dimensional input. Our strategies (Kernel) converge with significantly fewer function evaluations.
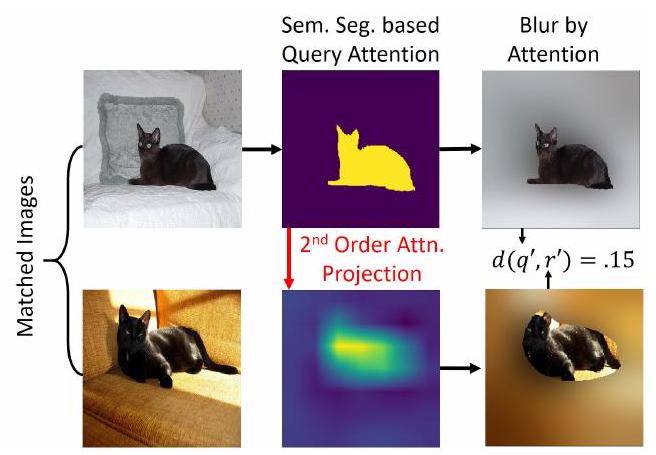
Figure 6: Our Second-order explanation evaluation strategy. A good method should project query objects (top left and middle) to corresponding objects in the retrieved image (bottom left and middle). When censoring all but these shared objects (right column) the search engine should view these images as similar.
Efficient Computation with Kernel Approximation
The proposed weighting kernel allows for efficient approximation of Shapley-Taylor indices, enabling faster computation without sacrificing accuracy. By sampling random coalitions and aggregating information into a weighted quadratic model, we achieve a significant reduction in computational overhead.
1.5 Second-Order Search Activation Maps
Applying the Shapley-Taylor framework, we derive second-order search activation maps, offering dense correspondences between query and retrieved image locations. These maps provide a deeper understanding of image similarity, facilitating more nuanced interpretations of visual search results.
Visualizing Second-Order Explanations
Using the derived Shapley-Taylor indices, we construct matrices representing the interaction strength between query and retrieved image locations. These matrices allow us to visualize how different parts of the query image correspond to parts of the retrieved image, providing intuitive insights into the similarity judgments made by the search algorithm.
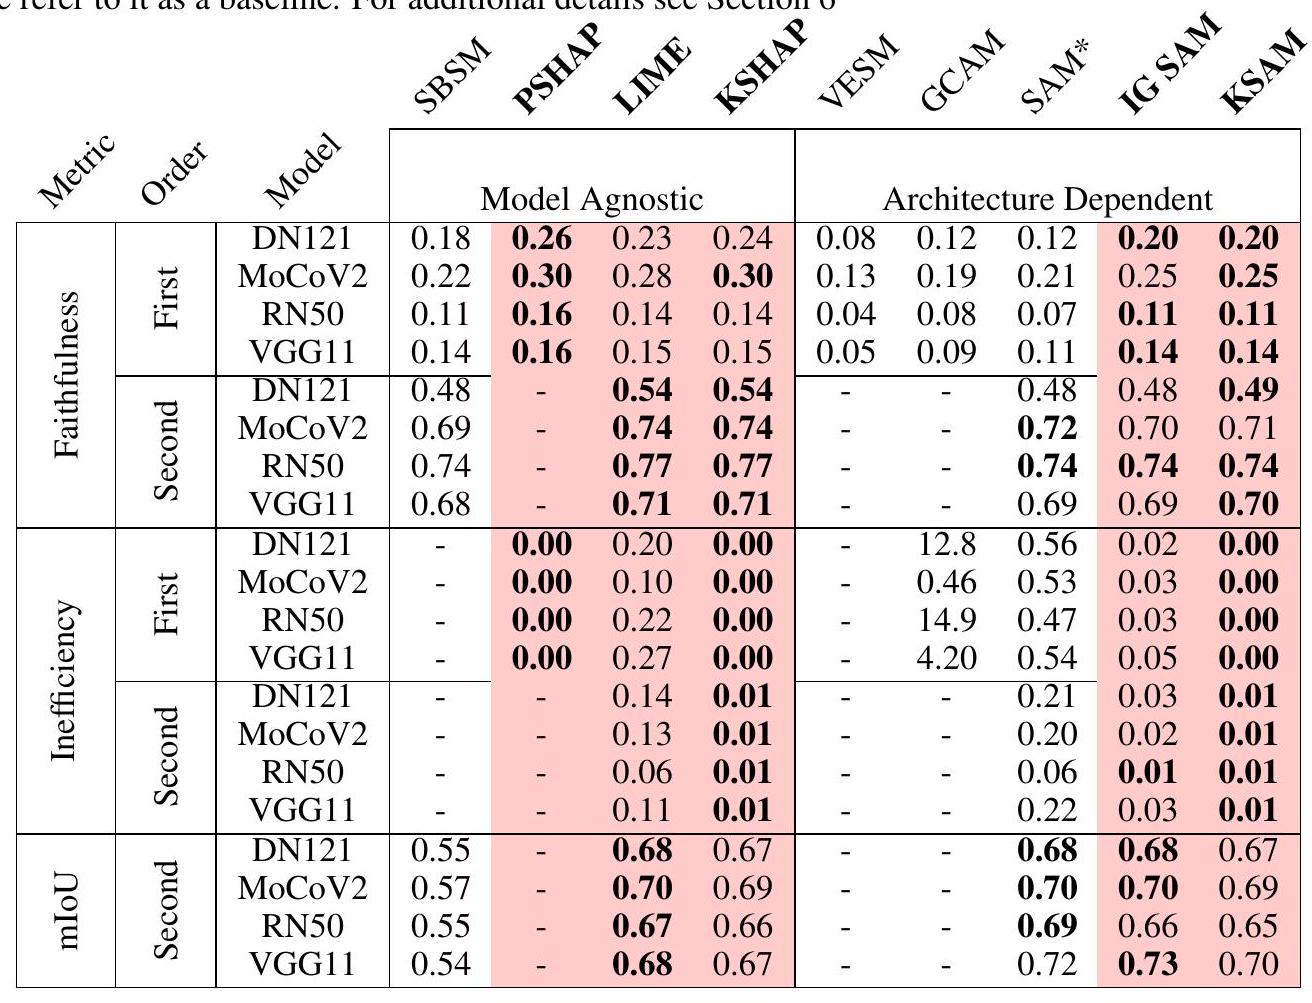
Table 1: Comparison of performance of first- and second-order search explanation methods.
2. Implementing Second-Order Explanations in Practice
With a solid theoretical foundation in place, we now turn our attention to practical implementation steps for incorporating second-order explanations into existing visual search systems.
2.1 Data Preparation and Preprocessing
Before integrating second-order explanations, it’s crucial to preprocess and structure the data appropriately. This involves organizing the dataset into query-image pairs, ensuring consistency in image format, resolution, and preprocessing steps such as normalization and resizing.
Data Pipeline Overview
We design a robust data pipeline encompassing data loading, preprocessing, and augmentation stages. Leveraging popular libraries like TensorFlow and PyTorch, we streamline the process of preparing the dataset for training and evaluation.
2.2 Model Modification and Integration
To enable the computation of second-order explanations, we modify the existing visual search model architecture. This adaptation involves incorporating additional layers or modules to capture the interactions between query and retrieved images.
Architectural Adjustments
We introduce novel components such as interaction modules or attention mechanisms to facilitate the computation of second-order explanations. These architectural adjustments enable the model to learn and represent the complex relationships between different regions of query and retrieved images.
2.3 Training and Evaluation Procedures
Training a visual search model with second-order explanations requires careful consideration of training objectives, loss functions, and evaluation metrics. We devise training procedures that optimize both the primary search task and the secondary objective of generating accurate explanations.
Objective Function Formulation
We define a composite objective function that combines the primary search task loss with a regularization term for encouraging meaningful second-order explanations. This formulation ensures that the model learns to balance between search accuracy and explanation fidelity during training.
2.4 Validation and Interpretation
Once trained, we validate the effectiveness of the model’s second-order explanations through comprehensive evaluation procedures. This involves qualitative analysis of explanation maps, quantitative assessment of explanation quality, and user studies to gauge the interpretability of the generated explanations.
Evaluation Metrics
We define metrics such as explanation fidelity, coherence, and relevance to quantitatively evaluate the quality of second-order explanations. By comparing against baseline methods and human annotations, we assess the model’s ability to capture meaningful interactions between query and retrieved images.
2.5 Deployment Considerations
Deploying a visual search system with second-order explanations requires careful planning and integration into existing infrastructure. We address scalability, latency, and user experience considerations to ensure seamless deployment in real-world applications.
Scalable Inference Architecture
We design an inference pipeline optimized for efficient computation of second-order explanations in production environments. This involves leveraging distributed computing frameworks and model optimization techniques to minimize latency and maximize throughput.
3. Conclusion
By following these implementation steps, we bridge the gap between theoretical insights and practical deployment of second-order explanations in visual search systems. Our approach empowers users to gain deeper insights into the underlying mechanisms driving search results, paving the way for more transparent and interpretable AI systems.
Additional Resources
- Video Description: Dive deeper into the concepts with a detailed video overview available here.
- Code Repository: Access the training and evaluation code to explore the implementation details here.
For a comprehensive exploration of the technical details and experimental results, refer to the full paper.
REFERENCES
Radhakrishna Achanta, Appu Shaji, Kevin Smith, Aurelien Lucchi, Pascal Fua, and Sabine Süsstrunk. Slic superpixels. Technical report, 2010.
Jiwoon Ahn, Sunghyun Cho, and Suha Kwak. Weakly supervised learning of instance segmentation with inter-pixel relations. In Proceedings of the IEEE Conference on Computer Vision and Pattern Recognition, pp. 2209-2218, 2019.
Marco Ancona, Cengiz Oztireli, and Markus Gross. Explaining deep neural networks with a polynomial time algorithm for shapley value approximation. In International Conference on Machine Learning, pp. 272-281. PMLR, 2019.
Robert J Aumann and Lloyd S Shapley. Values of non-atomic games. Princeton University Press, 2015.
Sebastian Bach, Alexander Binder, Grégoire Montavon, Frederick Klauschen, Klaus-Robert Müller, and Wojciech Samek. On pixel-wise explanations for non-linear classifier decisions by layer-wise relevance propagation. PloS one, 10(7):e0130140, 2015.
Yoshua Bengio, Aaron Courville, and Pascal Vincent. Representation learning: A review and new perspectives. IEEE transactions on pattern analysis and machine intelligence, 35(8):1798-1828, 2013.
Bing. Beyond text queries: Searching with bing visual search, Jun 2017. URL https://aka. ms/AAas 7 jg.
Holger Caesar, Jasper Uijlings, and Vittorio Ferrari. Coco-stuff: Thing and stuff classes in context. In Proceedings of the IEEE conference on computer vision and pattern recognition, pp. 12091218, 2018.
Mathilde Caron, Ishan Misra, Julien Mairal, Priya Goyal, Piotr Bojanowski, and Armand Joulin. Unsupervised learning of visual features by contrasting cluster assignments. arXiv preprint arXiv:2006.09882, 2020.
Hila Chefer, Shir Gur, and Lior Wolf. Transformer interpretability beyond attention visualization. In Proceedings of the IEEE/CVF Conference on Computer Vision and Pattern Recognition, pp. 782-791, 2021.
Ting Chen, Simon Kornblith, Mohammad Norouzi, and Geoffrey Hinton. A simple framework for contrastive learning of visual representations. arXiv preprint arXiv:2002.05709, 2020a.
Xinlei Chen, Haoqi Fan, Ross Girshick, and Kaiming He. Improved baselines with momentum contrastive learning. arXiv preprint arXiv:2003.04297, 2020 b.
Yun-Chun Chen, Yen-Yu Lin, Ming-Hsuan Yang, and Jia-Bin Huang. Show, match and segment: Joint weakly supervised learning of semantic matching and object co-segmentation. IEEE Transactions on Pattern Analysis and Machine Intelligence (PAMI), 2020c.